Dashware Gauges for Video: Difference between revisions
No edit summary |
m Danno moved page Dashware Gauges for video to Dashware Gauges for Video |
||
| (4 intermediate revisions by the same user not shown) | |||
| Line 8: | Line 8: | ||
==Step-by-step instructions:== | ==Step-by-step instructions:== | ||
[[File:Dashware1.jpg|thumb|alt="Screen shot of Featherweight Interface Program"|Fig. 1: Example data in Featherweight Interface Program]] | |||
1. Begin by exporting your altimeter data to a CSV (comma separated value) file. This is a plain-text file format so you can open a CSV file in Windows Notepad or other text editor to make sure you have the data you're after. You will want to export each data channel as a separate file - in this case, we'll have one file for altitude and one file for velocity. | 1. Begin by exporting your altimeter data to a CSV (comma separated value) file. This is a plain-text file format so you can open a CSV file in Windows Notepad or other text editor to make sure you have the data you're after. You will want to export each data channel as a separate file - in this case, we'll have one file for altitude and one file for velocity. | ||
For a Featherweight altimeter, you will do this in the Featherweight Interface Program. Load the .FIPA data file and select the [Altitude (Baro-Ft-AGL)] parameter | For a Featherweight altimeter, you will do this in the Featherweight Interface Program. Load the .FIPA data file and select the [Altitude (Baro-Ft-AGL)] parameter as shown in Fig. 1. | ||
With only that one parameter highlighted, right-click on it and select Save Data → Time Paired. Save the file as “altitude.csv” (or some other descriptive name). If you open that file in Notepad or another text editor, it should look something like this: | With only that one parameter highlighted, right-click on it and select Save Data → Time Paired. Save the file as “altitude.csv” (or some other descriptive name). If you open that file in Notepad or another text editor, it should look something like this: | ||
Time@[Altitude (Baro-Ft-AGL)],[Altitude (Baro-Ft-AGL)],bILBA 0.04375,1.75061,b0000 0.09375,1.75061,b0000 0.14375,0.623657,b1000 0.19375,-0.503296,b1000 : | Time@[Altitude (Baro-Ft-AGL)],[Altitude (Baro-Ft-AGL)],bILBA 0.04375,1.75061,b0000 0.09375,1.75061,b0000 0.14375,0.623657,b1000 0.19375,-0.503296,b1000 : | ||
Repeat this step for the [Velocity (Accel-MPH)] parameter (or whichever other parameter(s) you prefer) and save them in separate files so you know which is which. | Repeat this step for the [Velocity (Accel-MPH)] parameter (or whichever other parameter(s) you prefer) and save them in separate files so you know which is which. | ||
<br clear=all> | |||
[[File:Dashware2.jpg|thumb|alt="Dashware project creation dialog"|Fig. 2: Dashware project creation dialog]] | |||
2. Start DashWare, load the video clip you want to overlay gauges on, and name your DashWare project: | 2. Start DashWare, load the video clip you want to overlay gauges on, and name your DashWare project: | ||
3. DashWare will helpfully put some random gauges on your video for you. You'll probably want to delete these by selecting them in the video window and hitting [DEL]. | 3. DashWare will helpfully put some random gauges on your video for you. You'll probably want to delete these by selecting them in the video window and hitting [DEL]. | ||
<br clear=all> | |||
[[File:Dashware3.jpg|thumb|alt="Dashware gauge toolbox"|Fig. 3: The Gauge Toolbox tab]] | |||
4. Select the “Gauge Toolbox” tab on the right and drag the gauge you want into the video window. If your data file is metric, make sure you select a metric gauge. Adjust its size and placement by dragging the corners of its outline. | 4. Select the “Gauge Toolbox” tab on the right and drag the gauge you want into the video window. If your data file is metric, make sure you select a metric gauge. Adjust its size and placement by dragging the corners of its outline. | ||
<br clear=all> | |||
[[File:Dashware4.jpg|thumb|alt="Dashware data profile editor"|Fig. 4: The Data Profile Editor]] | |||
5. Next, you will need to import your CSV data files into DashWare - but if this is your first project, you will need to tell DashWare how to interpret those files. Go back to the “Project” tab and click the “plus” (+) button next to the “Data Files” field. You will be prompted to select a data file and a data profile. Hit the “Browse” button and select your altitude CSV file. If you've already created data profiles in a previous project, you should be able to simply select them from the drop-down list and continue to step 6; if not, hit “Edit Profiles”: | 5. Next, you will need to import your CSV data files into DashWare - but if this is your first project, you will need to tell DashWare how to interpret those files. Go back to the “Project” tab and click the “plus” (+) button next to the “Data Files” field. You will be prompted to select a data file and a data profile. Hit the “Browse” button and select your altitude CSV file. If you've already created data profiles in a previous project, you should be able to simply select them from the drop-down list and continue to step 6; if not, hit “Edit Profiles”: | ||
| Line 43: | Line 55: | ||
5e. Set up the second column (altitude) by clicking the plus (+) button in the “Column Mappings” section again. Select “[Altitude (Baro-Ft-AGL)]” (or whatever the name of your altitude value is) for Input Data Column, “Positional” for Map to Data Category, and “Altitude/Z Position (Feet)” for Map to Data Type. [Note: if your altitude data is metric, hopefully you selected a metric gauge back in step 4 - and you will want to select the metric data type here as well.] Click “Add.” | 5e. Set up the second column (altitude) by clicking the plus (+) button in the “Column Mappings” section again. Select “[Altitude (Baro-Ft-AGL)]” (or whatever the name of your altitude value is) for Input Data Column, “Positional” for Map to Data Category, and “Altitude/Z Position (Feet)” for Map to Data Type. [Note: if your altitude data is metric, hopefully you selected a metric gauge back in step 4 - and you will want to select the metric data type here as well.] Click “Add.” | ||
Your Data Profile Editor window should look something like | <br clear=all> | ||
[[File:Dashware5.jpg|thumb|alt="Completed Dashware data profile"|Fig. 5: A completed Data Profile]] | |||
Your Data Profile Editor window should look something like Fig. 5. Click “OK.” | |||
5f. You should be back in the “Add Data File” window now. If the new profile you just created isn't already selected in this window, you should be able to select it from the drop-down under “Choose a data profile.” Do so, and click “Add.” | 5f. You should be back in the “Add Data File” window now. If the new profile you just created isn't already selected in this window, you should be able to select it from the drop-down under “Choose a data profile.” Do so, and click “Add.” | ||
6. Repeat all of step 5 to import your velocity data file (or whatever other data you want) and create a new data profile for it (e.g., “FIPA Velocity”). | 6. Repeat all of step 5 to import your velocity data file (or whatever other data you want) and create a new data profile for it (e.g., “FIPA Velocity”). | ||
<br clear=all> | |||
[[File:Dashware6.jpg|thumb|alt="Dashware synchronization tab"|Fig. 6: The Synchronization tab]] | |||
7. The last tricky part is synchronizing the data stream with the video. Go to the “Synchronization” tab. You will see two timelines with sliders and playback controls - the one on the left controls the video and the one on the right controls your data streams. Use the controls on the left to find the point in your video where you want to sync (typically, the first motion of your rocket as it lifts off), and then use the controls on the right to find that same point in your data (where you see your gauges start moving). Once the two are aligned, click the “Sync with Video” check box, which is at the bottom center of the screen. Repeat this step for each of your data files by selecting each data file in the drop-down at the top of the window. | 7. The last tricky part is synchronizing the data stream with the video. Go to the “Synchronization” tab. You will see two timelines with sliders and playback controls - the one on the left controls the video and the one on the right controls your data streams. Use the controls on the left to find the point in your video where you want to sync (typically, the first motion of your rocket as it lifts off), and then use the controls on the right to find that same point in your data (where you see your gauges start moving). Once the two are aligned, click the “Sync with Video” check box, which is at the bottom center of the screen. Repeat this step for each of your data files by selecting each data file in the drop-down at the top of the window. | ||
| Line 54: | Line 74: | ||
One other note - in my flights with the Raven, I have altitude data for the entire flight, but velocity data only for the ascent. The quickest way I found to make the velocity gauge go away was to use DashWare to create a video with both gauges, then delete the velocity gauge and create another video with just the altitude gauge. Then I edit these together in my video editor. There may be a tricky way to have gauges appear and disappear in DashWare, but if so, I haven't figured it out yet. | One other note - in my flights with the Raven, I have altitude data for the entire flight, but velocity data only for the ascent. The quickest way I found to make the velocity gauge go away was to use DashWare to create a video with both gauges, then delete the velocity gauge and create another video with just the altitude gauge. Then I edit these together in my video editor. There may be a tricky way to have gauges appear and disappear in DashWare, but if so, I haven't figured it out yet. | ||
[[Category:How-to]] | |||
Latest revision as of 17:51, 19 June 2021
I've been asked a couple of times about how I put the altimeter and speed gauges on my videos. It's not very straightforward, so I have compiled it here as a step-by-step recipe. This walkthrough uses a Featherweight Raven altimeter, so your exact method may vary slightly if you have something different.
The software I use is called DashWare and it costs $50 UPDATE: is now FREE!
UPDATE June 3 2017: Good news everyone! I have no idea how long ago this happened, but DashWare (now owned by GoPro) have released an update that works (nearly) perfectly on Windows 10! Beginning with Dashware version 1.9.0, you should be able to work in Win 10 without any playing any tricks with deleting or hiding DLLs or messing with codecs.
BIG thanks to GoPro for putting some programmer time into this, seeing as how DashWare is still a FREE product that they do not directly profit from. Get the new version HERE and take note that if you currently have a version of DashWare installed older than 1.9.0, you need to uninstall it completely before installing the new version. This will NOT wipe out any custom gauges or data import profiles you've created (although it's never a bad idea to make a backup first anyway).
Step-by-step instructions:
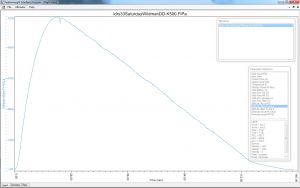
1. Begin by exporting your altimeter data to a CSV (comma separated value) file. This is a plain-text file format so you can open a CSV file in Windows Notepad or other text editor to make sure you have the data you're after. You will want to export each data channel as a separate file - in this case, we'll have one file for altitude and one file for velocity.
For a Featherweight altimeter, you will do this in the Featherweight Interface Program. Load the .FIPA data file and select the [Altitude (Baro-Ft-AGL)] parameter as shown in Fig. 1.
With only that one parameter highlighted, right-click on it and select Save Data → Time Paired. Save the file as “altitude.csv” (or some other descriptive name). If you open that file in Notepad or another text editor, it should look something like this:
Time@[Altitude (Baro-Ft-AGL)],[Altitude (Baro-Ft-AGL)],bILBA 0.04375,1.75061,b0000 0.09375,1.75061,b0000 0.14375,0.623657,b1000 0.19375,-0.503296,b1000 :
Repeat this step for the [Velocity (Accel-MPH)] parameter (or whichever other parameter(s) you prefer) and save them in separate files so you know which is which.
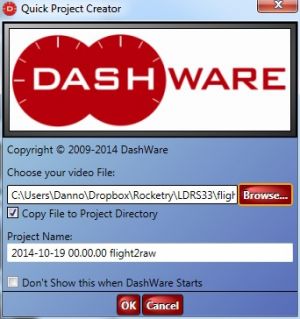
2. Start DashWare, load the video clip you want to overlay gauges on, and name your DashWare project:
3. DashWare will helpfully put some random gauges on your video for you. You'll probably want to delete these by selecting them in the video window and hitting [DEL].
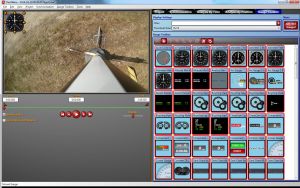
4. Select the “Gauge Toolbox” tab on the right and drag the gauge you want into the video window. If your data file is metric, make sure you select a metric gauge. Adjust its size and placement by dragging the corners of its outline.
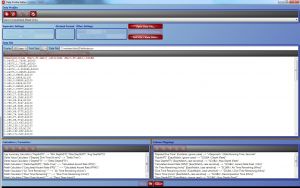
5. Next, you will need to import your CSV data files into DashWare - but if this is your first project, you will need to tell DashWare how to interpret those files. Go back to the “Project” tab and click the “plus” (+) button next to the “Data Files” field. You will be prompted to select a data file and a data profile. Hit the “Browse” button and select your altitude CSV file. If you've already created data profiles in a previous project, you should be able to simply select them from the drop-down list and continue to step 6; if not, hit “Edit Profiles”:
The window will appear with whichever profile is first in the alphabetical list (in this case, a SCUBA diving profile). Create a new profile for your altimeter data by clicking the plus (+) button in the upper-left corner of this window and give it a name like “FIPA Altitude”. Click “Add.”
The rest of this step will depend on which altimeter you have and what your particular CSV file looks like. Here are the steps for using the CSV file exported from FIP, but if your data file looks different you may need to improvise:
5a. Since the data is strictly comma-separated, deselect semicolon and tab in the separator box, leaving only comma selected.
5b. In the box where the contents of the data file are displayed, click on the first line (the header line which begins with “Time@” and hit “Mark Header Line.”
5c. Select the second line and hit “Mark Data Start.”
5d. Set up the first column (time) by clicking the plus (+) button in the “Column Mappings” section in the lower-right corner of the window. Select “Time@[Altitude (Baro-Ft-AGL)]” (or whatever the name of your exported time value is) for Input Data Column, then select “” for Map to Data Category and “Data Running Time, Seconds” for Map to Data Type. Click “Add.”
5e. Set up the second column (altitude) by clicking the plus (+) button in the “Column Mappings” section again. Select “[Altitude (Baro-Ft-AGL)]” (or whatever the name of your altitude value is) for Input Data Column, “Positional” for Map to Data Category, and “Altitude/Z Position (Feet)” for Map to Data Type. [Note: if your altitude data is metric, hopefully you selected a metric gauge back in step 4 - and you will want to select the metric data type here as well.] Click “Add.”
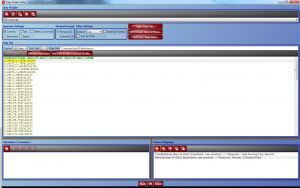
Your Data Profile Editor window should look something like Fig. 5. Click “OK.”
5f. You should be back in the “Add Data File” window now. If the new profile you just created isn't already selected in this window, you should be able to select it from the drop-down under “Choose a data profile.” Do so, and click “Add.”
6. Repeat all of step 5 to import your velocity data file (or whatever other data you want) and create a new data profile for it (e.g., “FIPA Velocity”).
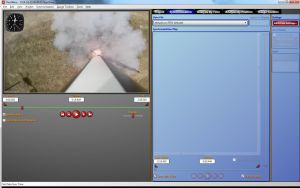
7. The last tricky part is synchronizing the data stream with the video. Go to the “Synchronization” tab. You will see two timelines with sliders and playback controls - the one on the left controls the video and the one on the right controls your data streams. Use the controls on the left to find the point in your video where you want to sync (typically, the first motion of your rocket as it lifts off), and then use the controls on the right to find that same point in your data (where you see your gauges start moving). Once the two are aligned, click the “Sync with Video” check box, which is at the bottom center of the screen. Repeat this step for each of your data files by selecting each data file in the drop-down at the top of the window.
8. At this point, you're basically done - save your project (File → Save Project) and then create your video (File → Create Video).
One other note - in my flights with the Raven, I have altitude data for the entire flight, but velocity data only for the ascent. The quickest way I found to make the velocity gauge go away was to use DashWare to create a video with both gauges, then delete the velocity gauge and create another video with just the altitude gauge. Then I edit these together in my video editor. There may be a tricky way to have gauges appear and disappear in DashWare, but if so, I haven't figured it out yet.
